
Projects
Project structure
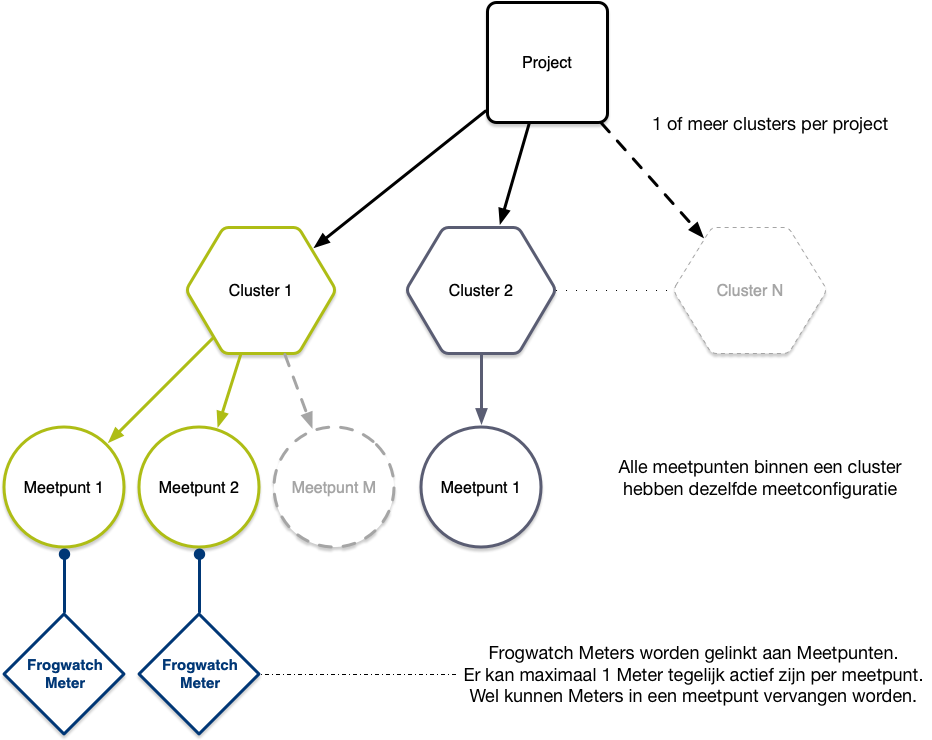
Vibration measurements with Frogwatch are done within the context of a project. Projects are divided into clusters, each with its own settings. Measurement points exist within a cluster. They often represent a physical location where measurements are needed.
Next, a Frogwatch Meter is placed at the measurement point to collect the vibration data. This is very flexible, because the data belongs to the measurement point, not to the meter. So you can replace the meter at a measurement point without any problems.
 .
.
Clusters
You create clusters and measurement points in the Clusters menu within a project. This usually takes four steps:
- Create a cluster. Optionally give the cluster a logical name.
- Add measurement points to the cluster. You can also give the measurement points a name.
- Select a Meter that will carry out the measurements for the measurement point.
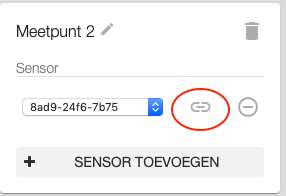
- Activate the meter at the measurement point by clicking the link icon. NOTE: if the meter is still active in another project at that moment, it will stop measuring there and get the measurement settings of the new cluster.
 .
.
As soon as measurement data has been received for 1 of the measurement points in a cluster, the measurement configuration is locked and the cluster can no longer be deleted.
You can move a meter to another measurement point at any time. You can also put it back at a previous measurement point later by clicking the link icon again.
Measurement configuration
You can set a measurement configuration per cluster. The configuration determines:
- When measurements are taken: on which days and between which times
- How measurements are taken: with which method, in which unit
- How the measurement is assessed: is a standard used, and which one?
Measurement period
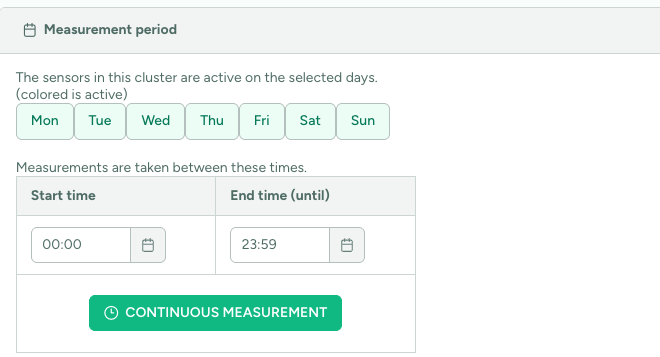
You can set on which days of the week measurements are taken, and between which times on those days the measurement points are active. Outside this period the meters are in power saving mode and do not measure. The meters only connect to the Frogwatch Dashboard now and then to check for new settings.
The measurement starts on each day marked green at the set start time and stops when the end time is reached. In the example below, the measurement is active Monday through Friday from 06:00 in the morning to 18:00 in the evening. Do you want to measure 24/7 without interruptions? The Measure continuously button makes all days active from 00:00 to 23:59. The measurement then runs without stopping.
Measurement method
Five measurement methods are currently supported:
- Structural Damage Monitoring Velocity (SBR A/C). Measuring with a damage standard in the velocity domain follows the SBR A guideline. This means that every second, one data point is calculated per axis (x, y and z direction). A data point consists of the dominant frequency and the corresponding peak value (velocity or acceleration) over a window of 1 second. The dominant frequency is determined using the standard. The standard is defined over the range of 1 - 100 Hz. The frequency with the most energy relative to the standard is the dominant frequency (this is determined with a Fast Fourier Transform). The peak value is determined in the time domain. For more information, see the official documentation of the SBR A and C guidelines. You can also measure without a standard. This means that the frequencies are not weighted and that measurements are not checked for exceedances of a standard.
- Structural Damage Monitoring Acceleration (SBR C). This method measures in the acceleration domain. Otherwise it is equivalent to Structural Damage Monitoring Velocity. This mode is suitable for SBR C acceleration standards.
- Nuisance Monitoring (SBR B). This method follows the SBR B guideline. This means that every 30 seconds a data point is calculated, from which a Vmax follows. This is a dimensionless number related to the vibration velocity (an effective value averaged over 30 seconds). So you can use this method with SBR B standards (and also without assessment against a specific standard).
- Raw Vibration Measurement. This method sends the vibration signal itself, without analysis such as SBR A. The meter samples at 1000 Hz and downsamples the signal to 100 Hz or 10 Hz.
- Calibration. Choose this measurement method if your meters need to be calibrated. It automatically applies the correct measurement settings. In this method the vibration data is also not sent to the Frogwatch Dashboard, so that the calibration goes faster.
Assessment
In most cases you will want to check whether the measured values exceed a particular standard. In that case, choose one of the available standards in the dropdown. Is the standard you need not in the list? You can add it yourself in the standards main menu. Besides the common SBR standards, this also lets you add your own special standard, for example for SBR C measurements.
You can also leave the assessment turned off. For SBR A/C, the dominant frequency is then not weighted against the standard (after all, none is set). Instead, the frequency of the highest peak in the FFT spectrum counts as the dominant frequency.
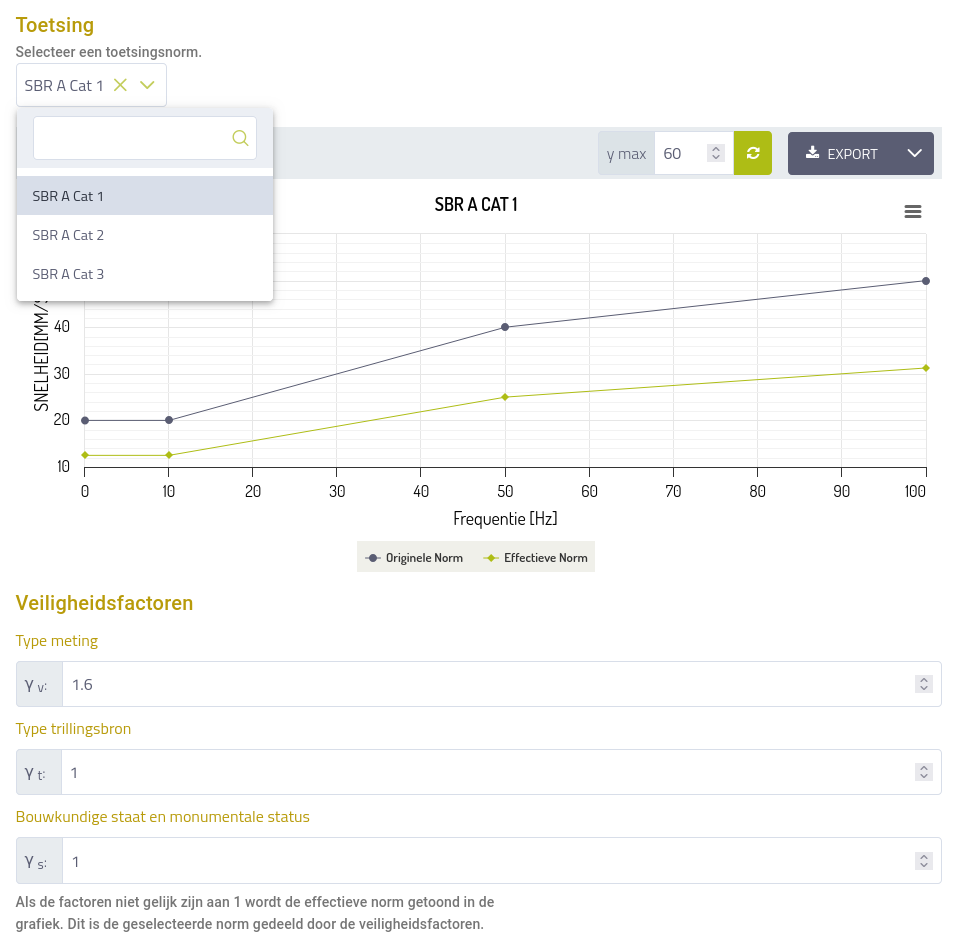
In the example below, the standard SBR A Cat 1 is selected. In dark blue you see this standard drawn as it is defined in the SBR. Next, you can fill in various safety factors. You choose these based on the type of measurement, the vibration source and the structural condition, as described in the SBR. In the graph you see in green the effective standard as it will be applied: this is the original standard divided by all safety factors.
Monitoring
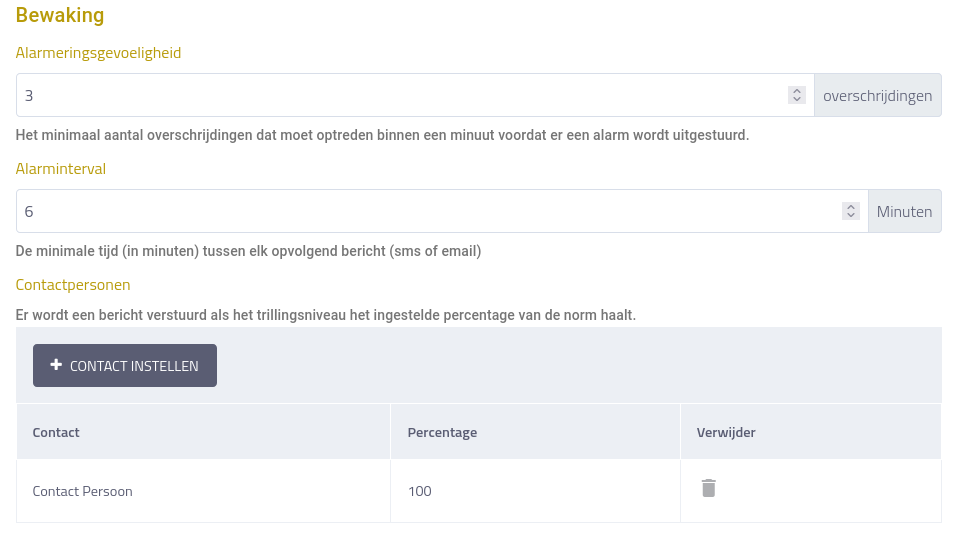
If you have chosen a standard under assessment, the Monitoring section appears. Here you can set who gets a notification when the vibration level reaches a certain percentage of the standard. You can set this percentage per contact. For example, you can send yourself a warning at 75% and only send an alarm to your client when 100% is exceeded.
Alert sensitivity
The minimum number of exceedances that must occur within one minute before an alarm is sent. If you set it to 3, for example, an exceedance message is only sent if a certain vibration level was measured 3 times within 1 minute.
Alarm interval
The minimum time in minutes between consecutive messages (SMS or email). This setting works as a rate limit and makes sure contacts do not get notifications too often, even when there are exceedances. The idea is to prevent so many 'false alarms' being sent for interfering vibrations that the real exceedances are then ignored. Exceedances are, however, always passed on to the Frogwatch Dashboard.
Contacts
In the contacts table you can set who gets a message at a certain vibration level relative to the standard. The standard is 100% here. So to receive notifications when the vibration level almost causes an exceedance of the standard, you fill in, for example, 95% for a particular contact.
Contacts are added per project. You do this in the Access menu within the project. There you can also set whether contacts are alerted by SMS or email, and on which days this is or is not allowed.
Example
In the example below, an Alert sensitivity of 3 exceedances per minute and an Alarm interval of 6 minutes are chosen. This means that an alarm is only sent if both:
- There were at least 3 exceedances in total within the past minute
- No alarm was already sent to the contact in question in the 6 minutes before that
Traces
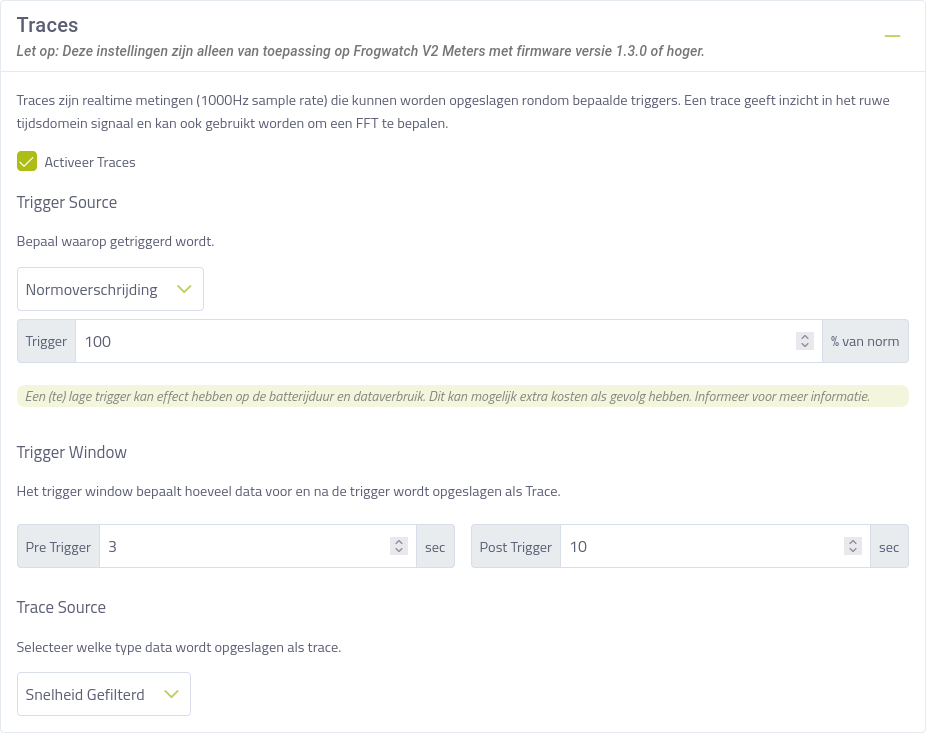
Traces let you view extra detailed information: a trace is a piece of real-time measurement data that can be stored around a so-called trigger moment.
You can set what causes this trigger moment and how long the stored trace is.
Trigger Source
First you choose what causes the trigger, by choosing the Trigger Source. You can choose from two types:
- A percentage of the standard: choose Exceedance of standard
- A fixed vibration value in mm/s or mm/s2: choose Vibration value.
In most cases 100% of the standard is a good value. A fixed vibration value can be useful if, for example, you want to find the cause of a known vibration. Make sure you do not choose a value that is too low, to keep the number of traces manageable.
Trigger window
This determines how much data you want to collect per trigger: a number of seconds before (Pre-Trigger) through a number of seconds after (Post-Trigger) the trigger is exceeded. A few seconds is usually enough. You can set it a bit longer for extra context, for example when a vibration builds up or dies out slowly.
Trace Source
Finally, you can choose which type of data you want to collect. The default is usually right, but you can change it independently of the Trigger Source. For example, you can choose to store a trace of acceleration or of Veffective, regardless of how the Trigger Source is set.
In the example below, an exceedance of the standard will send a trace of velocity data from 3 seconds before the exceedance through 10 seconds after the exceedance.
Viewing traces
The chapter Viewing vibration data explains how to view the trace data.
Project info
On the Info page within a project you can fill in project details and metadata. You can also upload documents, for example measurement plans. Clients or other people with an account who have been given access to this project can view this page.
When the project has ended, you can archive it here. The project then disappears from the list of active projects. You can make the project active again at any time if needed.
Notifications
The Notifications page shows messages from the Meters that are active in the project.
There are 4 types of notifications:
- Info These are service messages that tell you when a system has started up, started or stopped measuring, etc.
- SBR notifications are sent when there has been an exceedance of the standard. This notification shows the exact time and the vibration level relative to the standard.
- Error If something goes wrong during measuring or with the normal operation of a Frogwatch Meter, this is reported with Error notifications. The meters try to detect what exactly is going wrong or what is broken and report it this way. Think of a broken sensor or a corrupt SD card. These notifications usually require action from the user. The meter may also need servicing.
- Warning messages are expected exceptions that can happen now and then, but that the meter can recover from by itself. You can often treat these as diagnostic notifications.
Scheduled measurements and self-test
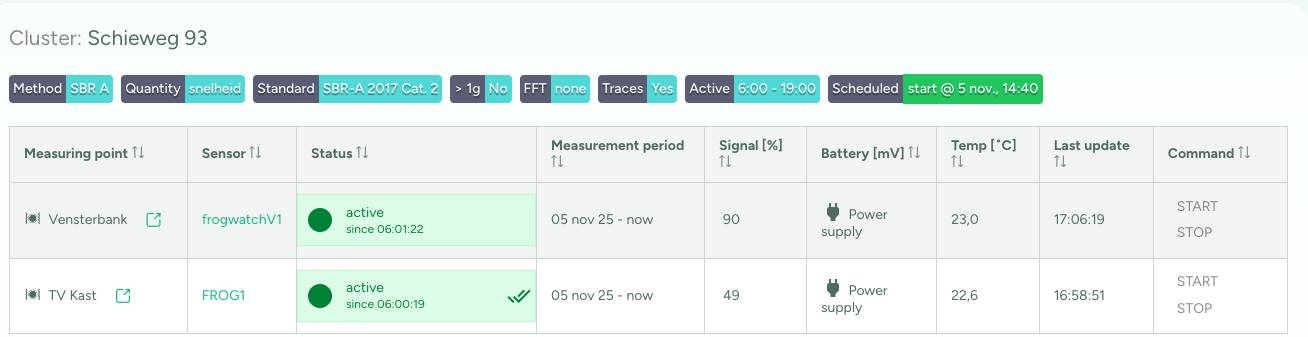
In the Project -> status menu you see the current status of all meters, grouped by cluster.
With the "Plan start/stop" button you can schedule the start or end of the measurement.
If the chosen date/time is not in the future, the schedule takes effect immediately once the sensors receive it.
 .
.
Scheduled start
As soon as you schedule a start, all meters in the cluster will:
- run a self-test when they receive the new schedule
- run another self-test 2 days before the scheduled start (if applicable)
- start measuring at the scheduled start according to the configured measurement period (status becomes Active or Standby).
If a meter is not active according to the schedule after all, the Dashboard shows a warning. This can happen, for example, if you stop the meter manually (temporarily). If you do not want this, you can schedule a stop or remove ('forget') the current scheduled start.
Scheduled stop
All meters in the cluster will stop measuring at the scheduled moment (status becomes Stopped).
Reporting
The Frogwatch Dashboard can generate and send automatic reports. Reports are daily or weekly. What goes into the report is flexible. For each report you can choose which measurement points are included and which contacts should receive it. Notifications for newly available reports are sent by email in the morning around 8 o'clock.
You can add descriptions, photos and images to a report.
Besides automatic reporting, you can also generate a report manually for any time range. For example, for the last hour, or for a whole month. Manual reports are not sent automatically, but you can download them so you can send them yourself if you want.
Access
Users
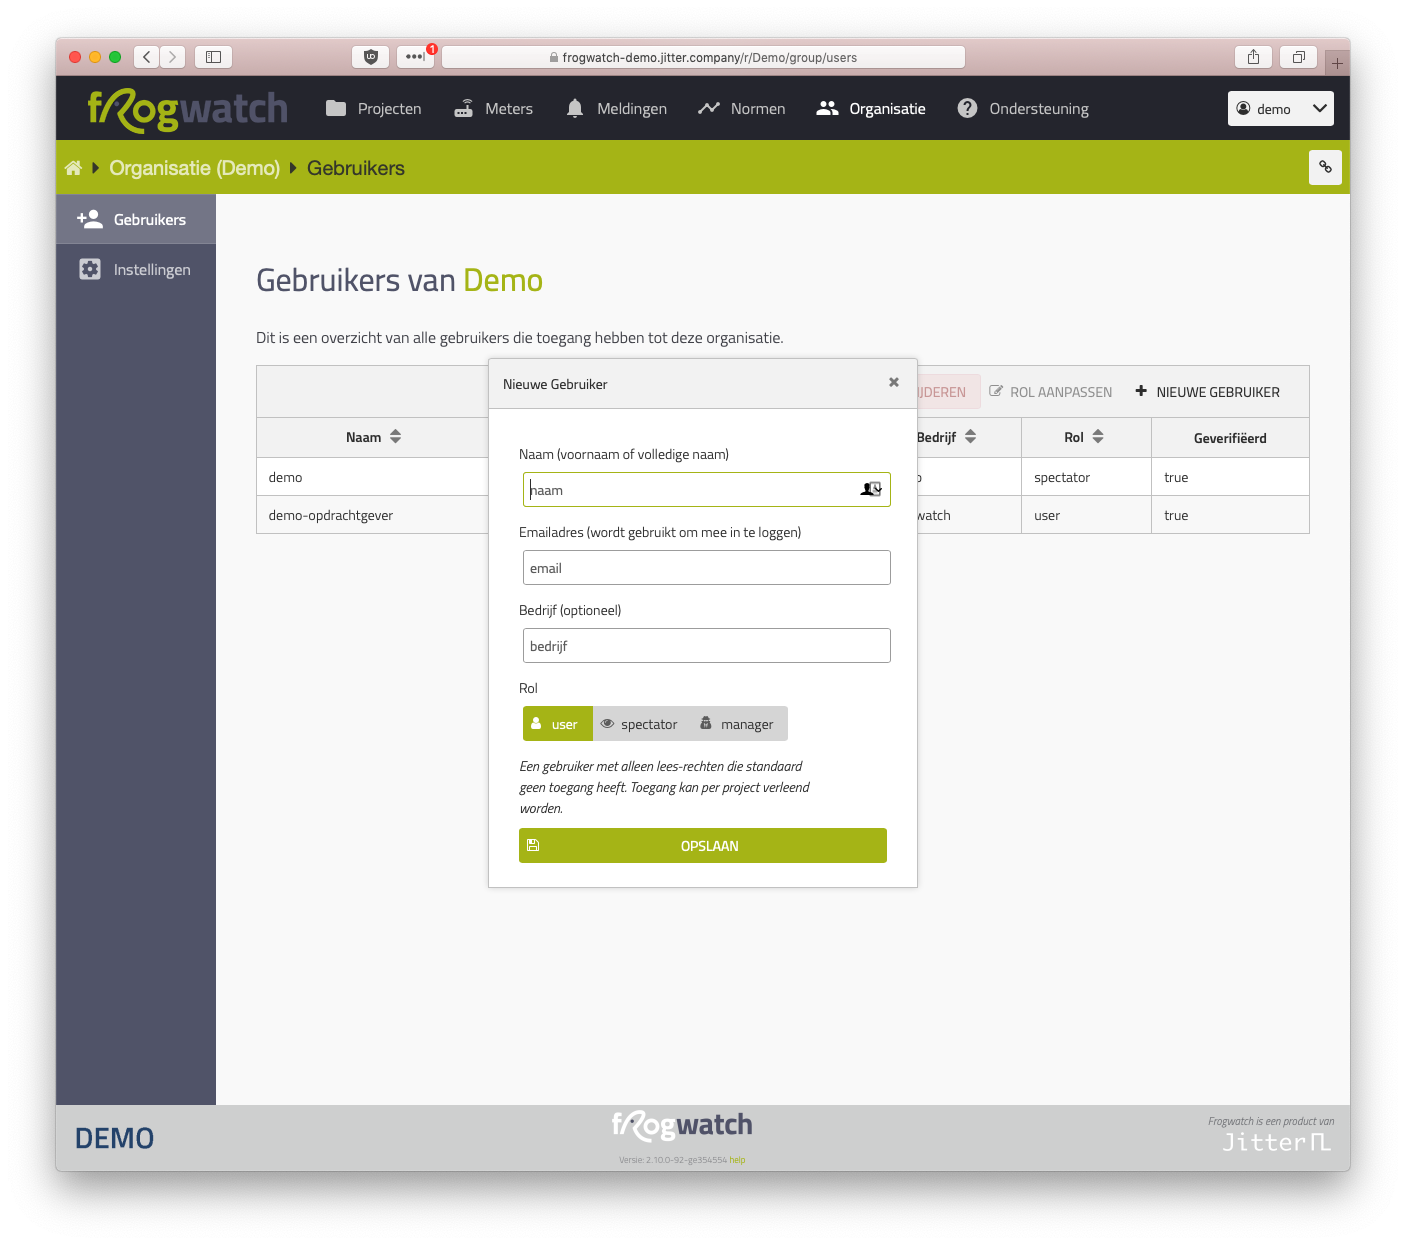
As an organization within Frogwatch, you can grant access and permissions to other users yourself. There are 3 types of roles available:
ManagerA manager has all permissions within a group: read, write, delete, create new users.Spectatoris a user who does have read permissions for all projects and settings within the group, but cannot change anything.Userhas no permissions by default. This user cannot see/read or change anything. A manager can give users access to specific projects via theAccessmenu within a project. This is mainly intended for clients who would like to follow specific projects. Ausercan never change settings.
A new user automatically receives an email with a link to create a password.
 .
.
Contacts
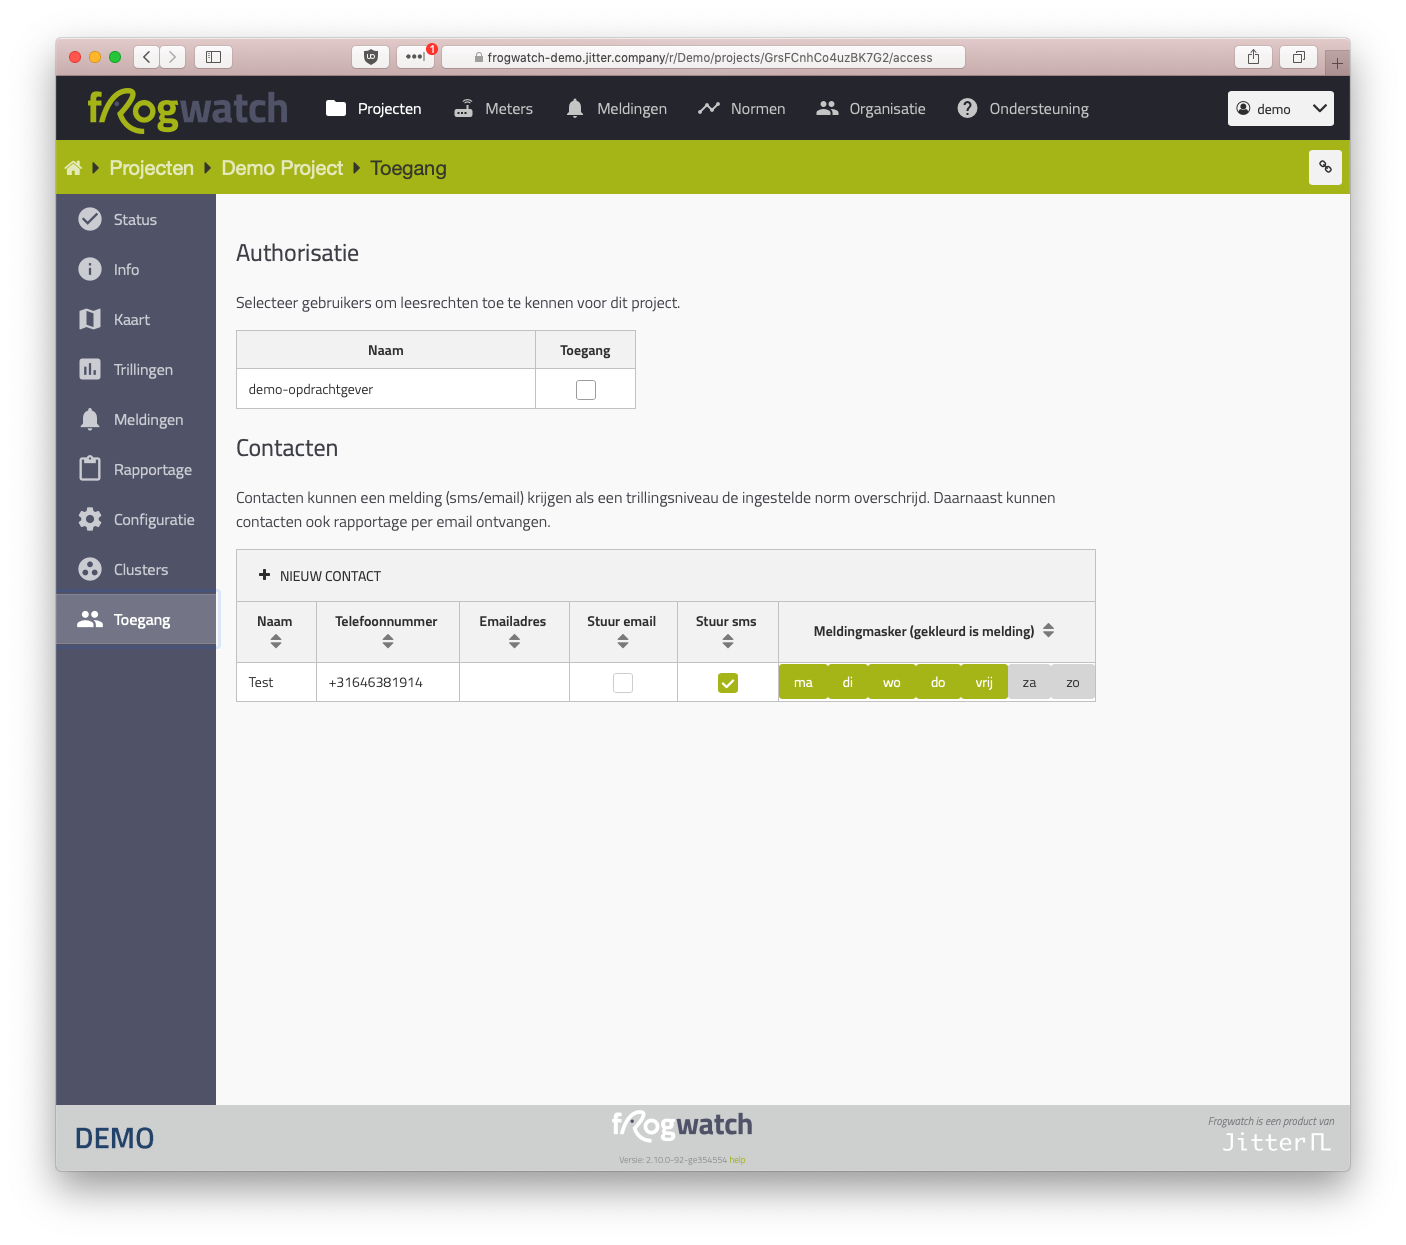
Besides users, there are also contacts. A contact cannot log in to the Dashboard, but can receive information in the form of emails and SMS messages. Messages can be sent when exceedances of a standard are measured, or when a new report with vibration data is available.
Unlike a user, contacts are set per project. When you define a new contact, you must fill in an email address and/or a phone number. You must also explicitly indicate whether emails and/or SMS messages should be sent. This lets you turn notifications on or off for this contact. There is also a notification mask that indicates on which days messages may be sent. For example, only on the days that a contact is at work.
 .
.
Vibration standards
The Frogwatch Dashboard lets you define vibration standards flexibly. This makes it very easy to measure against different standards. A distinction is currently made between damage standards and nuisance standards. Damage standards can be defined in both the acceleration domain and the velocity domain, so both SBR A and SBR C are supported. Nuisance standards measure according to the SBR B guideline.
Damage standards (SBR A and SBR C)
Go to the Standards main menu item and click Damage standards. This shows a list of all standards that have been created.
Defining a standard
Click + NEW STANDARD at the top of the list.
The standard is defined by frequency - acceleration/velocity pairs.
Choose the type of standard: velocity or acceleration. Then add a number of data points that together form a standard through interpolation.
Choose a unique name for the standard and click SAVE. The standard now appears in the list.
 .
.
Nuisance standards (SBR B)
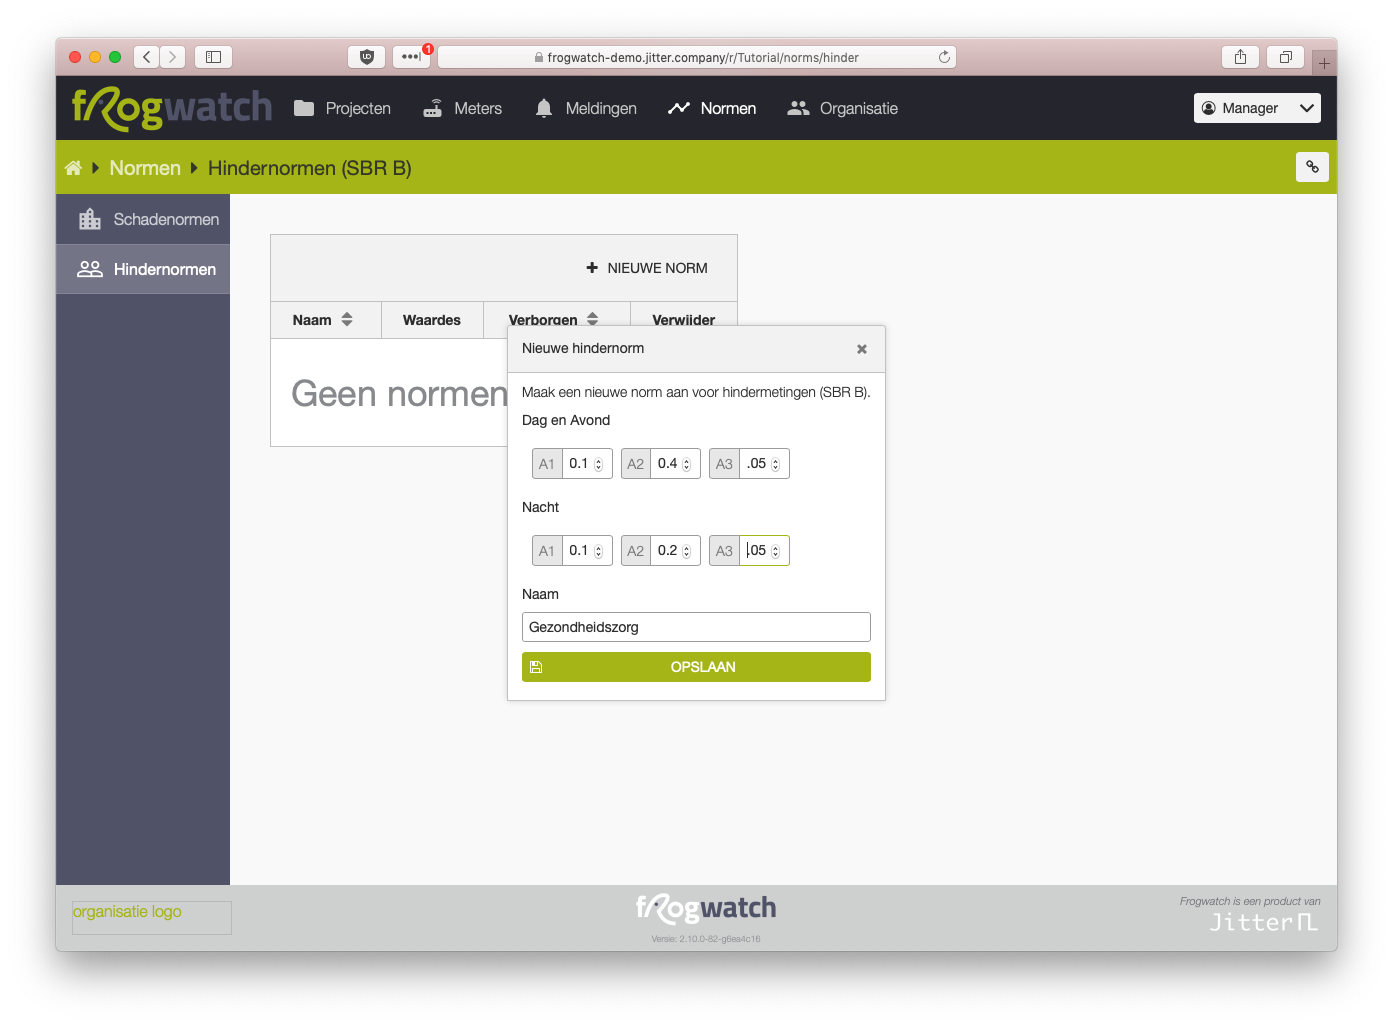
As described in the SBR B guideline, a nuisance standard consists of 6 values. Three values for the day and evening period, and 3 values for the night period.
Defining a standard
Go to the Standards main menu item and click Nuisance standards. This shows a list of all standards that have been created. Click + NEW STANDARD at the top of the list.
A popup appears with 7 input fields: the values A1, A2 and A3 for both the day/evening and the night period, and 1 field for the unique name of the standard.
Device status overview
In the Devices main menu item you see an overview of all meters within the organization. A similar overview is also available for the status within a single project: go to Projects and choose a project, or click status in the left menu.
In the overview you see a Status column. This column summarizes what the sensor is doing. The table below explains what each status means.
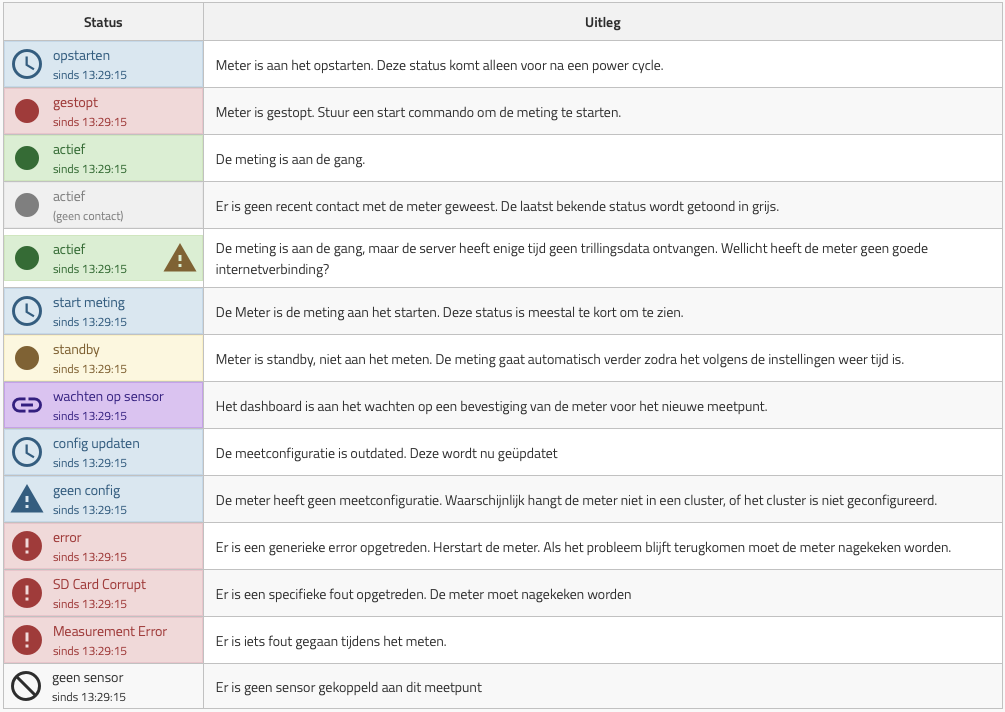
The status table also has a number of other columns with information about the meter:
Measurement period: since when the measurement has been active and when it was last stopped.Signal: an indication of the network coverage (100% is perfect, 0% is very poor)Battery: how full the battery is and whether the power supply is connected.Temp: the temperature inside the meter. This gives a fair idea of whether the meter is indoors or outdoors.Last Update: the time the meter last made contact with the Dashboard. Information from after this time is not yet available.Command: lets you queue aSTARTorSTOPfor the meter. As soon as the meter comes online, the measurement will be started or stopped.