
Integrated Structural and Nuisance Monitoring Platform
Monitor for damage to buildings or nuisance to people in buildings. Measure according to various standards such as the Dutch SBR A, SBR B or C or with a custom standard adapted to the situation. View vibrations in both velocity and acceleration.
With the online Dashboard, you can easily manage all aspects of a vibration monitoring project in one central place. Set up measurement points, assign sensors, and choose the corresponding measurement configurations. Give your client access to the project so they can also view the data themselves.
- Always in control
- Get real-time status updates and receive instant alerts via SMS or email if vibration limits are exceeded.
- Automated Reporting
- Save time with daily or weekly PDF reports, automatically sent to you or your client.
- Deep Insights
- Analyze triggered traces, compare data from multiple sensors, and export raw data for advanced analysis.
- Flexible Standards
- Besides Dutch SBR standards, we support international norms. Need a specific standard? Let us know and we'll add it for you.

Vibration monitoring made easy
The Frogwatch Vibration Sensor
Frogwatch faithfully stands guard over your projects without attracting the attention of vandals, thieves, or other riff-raff. The calibrated sensor contains all the components to monitor vibration nuisance, building damage, and equipment failure for you. Within ten minutes, you can follow the results in real-time on your Frogwatch Dashboard, be alerted in case of an exceedance, and start the periodic reports. Fast, complete, compliant with standards, and readable for everyone.
- Great Battery Life
- With the internal Battery Pack the device can measure autonomously for up to 10 weeks.
- Externally Calibrated
- The Frogwatch sensor is calibrated by an independent lab, ensuring accurate measurements.
- Deep Insights
- Get 1000Hz Triggered Traces on configurable triggers.

Compare data from different measurement points
Easily overlay graphs from different measurement points. This quickly gives you an impression of the vibration source.
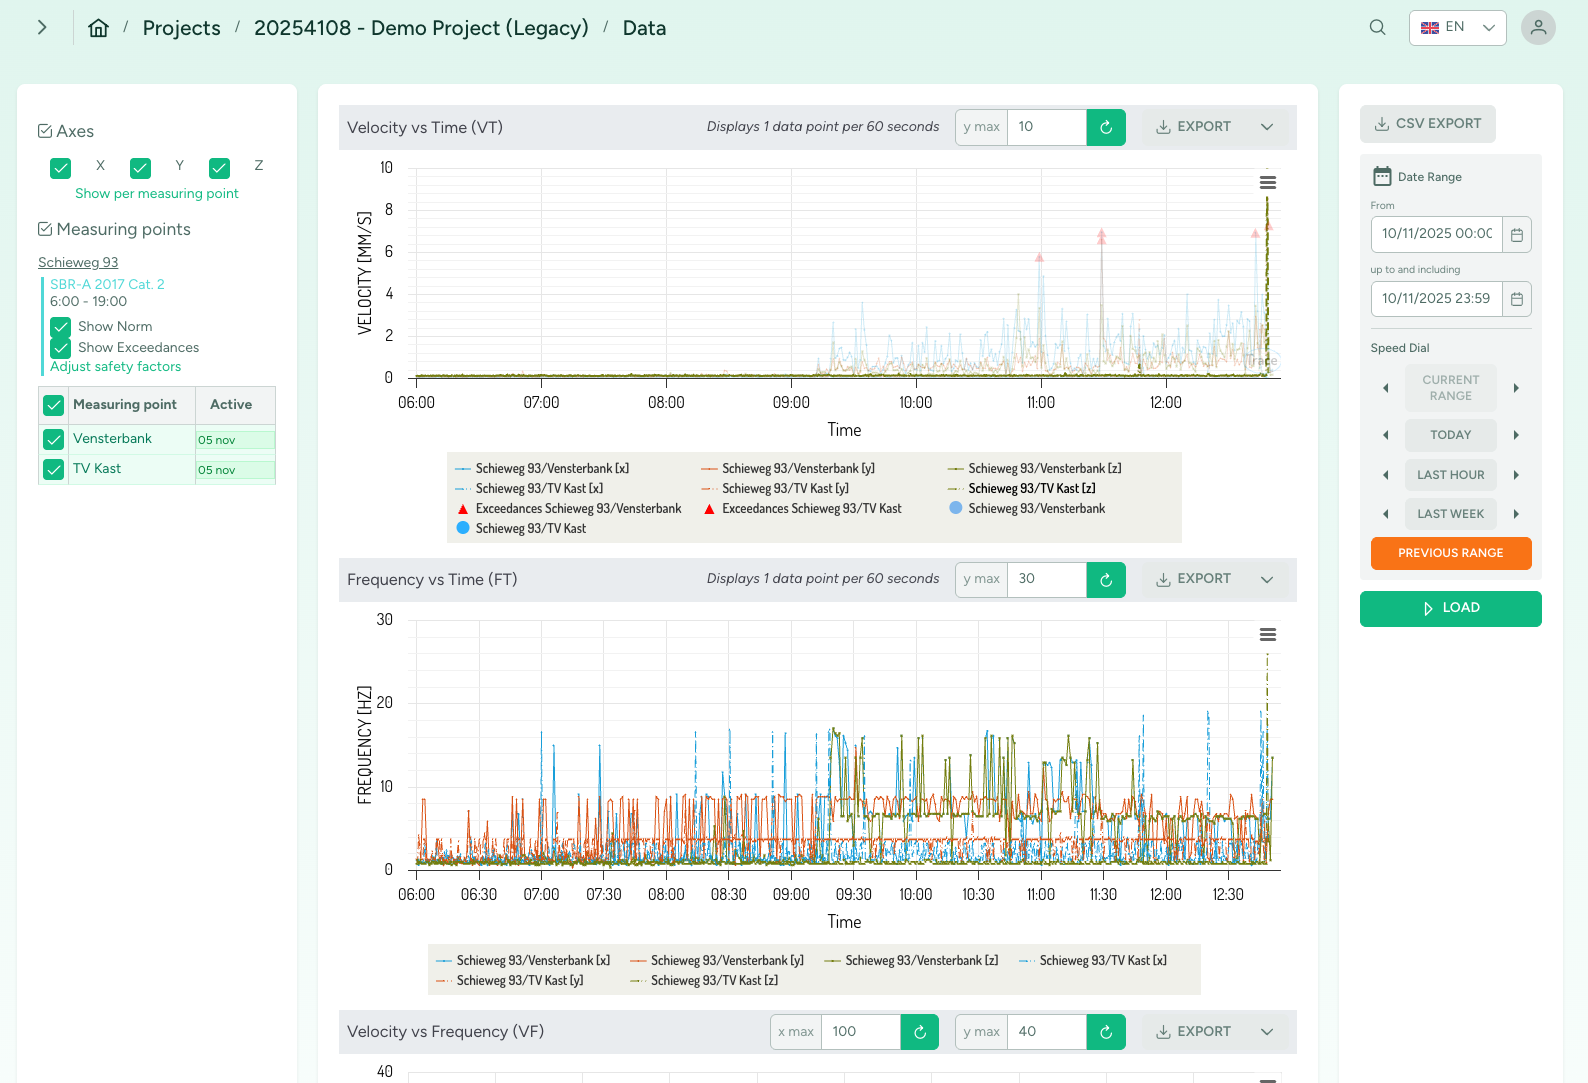
Real-time data and FFT
Triggered Traces
Gain insight into the vibration waveform around configurable triggers. The accompanying FFT shows you how the energy is distributed across the frequency spectrum.
Measure up to 10 seconds before and after the trigger. A trigger can be an SBR exceedance or a vibration value above a set level.
Export the graph or download the 1000 Hz data in CSV or Excel format for further analysis. For when you want to go beyond just SBR.
Read more in the introduction post...
In your inbox every day
Automated Reporting
Select the desired measurement points, add any descriptions or photos, and your report is ready. You can have it sent automatically daily or weekly: your client will then automatically receive a clear PDF report in their email.
Thanks to a pre-set format, you can present your client with an automatically generated report in your own look and feel every day. You determine what it contains in your measurement plan, which you can set up in ten minutes. The simple graphs and tables in the Frogwatch Report are easy for clients without technical knowledge to understand. With photos of the meters at your project location, the measurement points on the map, and a project description, you make the report personal for your client. A neat service from your company!

Via SMS or email
Flexible Alarms
An exceedance occurs when the measured values exceed the set standard. Alarms can be set for this.
For each cluster of measurement points, you can easily set who should receive a notification and when. For each contact person, you can choose from which percentage of the standard the notification is sent: this way you can keep a close eye on the vibration level and intervene more quickly where necessary.

Weighting curve for dominant frequency and peak values
Flexible Custom Standards
In most cases, you will measure according to the SBR A or B standards. Do you want more flexibility? With the Frogwatch Dashboard, you can go a step further and define your own weighting curve. For example, you can combine different standards or better align with the specific requirements for an SBR C measurement.
Want to give Frogwatch a try?
You can! Request a trial period and we'll send you the latest Frogwatch vibration sensor. Test it for a whole month for only €200!